Every business from a small store in South Mumbai to a large company runs on numbers. But have you ever wondered how …
If you want to get into the data analytics field or if you want to improve your skills you probably have a big question: Should I focus on Microsoft Excel or should I learn Power BI?
This is a choice. On one hand you have Excel, which you probably used in school and is on every computer at work. On the hand you have Power BI, which is Microsofts powerful business intelligence platform that recruiters always talk about in job descriptions.
Some people say Excel is old and outdated. Others say Power BI is too hard to use for tasks.. The truth is, neither tool is going away. If you want a paying job in data analysis it really matters which tool you focus on. Lets look at how these tools work in the corporate world.
Understanding the Basics: Excel vs Power BI
To figure out which tool is better for your career we need to look at what they were designed to do. Even though they have some similarities their main goals are very different.
What is Excel and What Does it Do?
Microsoft Excel is a spreadsheet application. Its biggest strength is that it is very flexible. You can use Excel to type in numbers make a budget build a calculator or do financial modeling.
In data analysis Excel is like a scratchpad. If your boss gives you a dataset and wants a quick summary Excel is still the fastest way to get it done. You can open Excel put the data into a PivotTable and write some formulas to get the answers you need.
What is Power BI. How is it Different?
Power BI is not a better version of Excel. It is a platform for data modeling and business intelligence. Of working with individual cells Power BI works with whole tables and relationships. You cannot just click on a cell in Power BI and type in a number; it is a read-only environment that gets data from other sources.
The goal of Power BI is to take messy datasets from different places combine them and turn them into interactive dashboards. It makes you think like a data architect, not a spreadsheet editor.
Head to Head Comparison: Five Key Areas
To make a decision for your career lets look at how these two platforms handle real world data challenges in five important areas.
1. Handling Big Data
Excel: Excel can handle one million rows of data but it starts to slow down long before that. If your files are too big Excel will. Even crash.
Power BI: Power BI can handle millions or even billions of rows of data without any problems. If you need to analyze a lot of data Excel just can’t keep up.
2. Ease of Use and Learning
Excel: Excel is easy to start using. Anyone can open a sheet and type in numbers.. To use advanced features like formulas and macros you need to practice.
Power BI: Power BI is harder to learn. You need to understand data concepts like normalization and relationships. You also need to learn a language called DAX to build metrics.
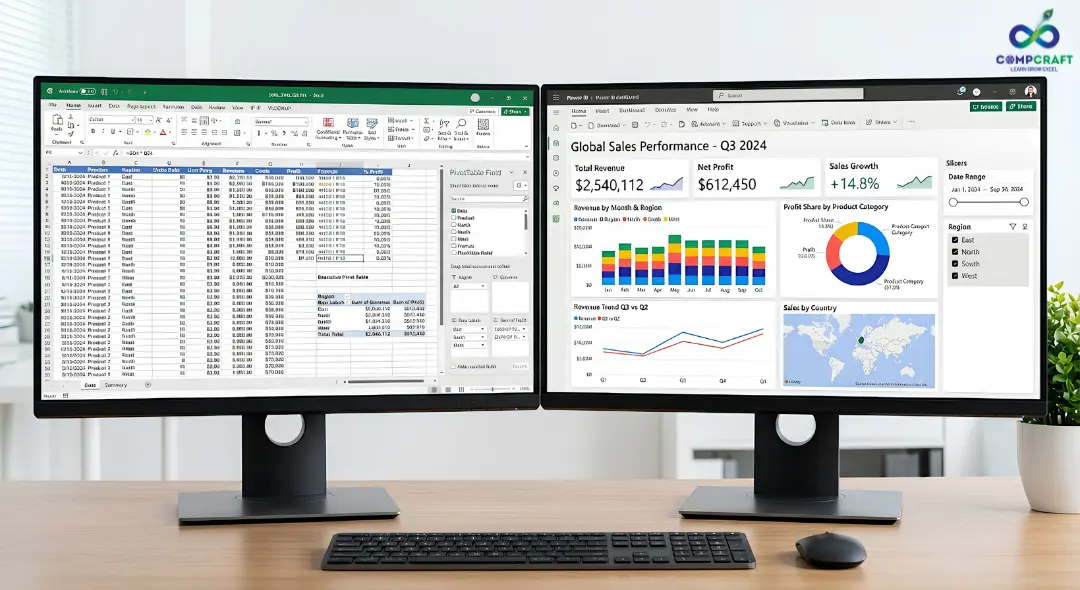
3. Data Visualization
Excel: Excel has charts like bar charts and line graphs but they are not interactive.
Power BI: Power BI has interactive charts that change when you click on them. This makes it easy to explore data and see relationships.
4. Reporting
Excel: Updating an Excel report is usually a task that takes a lot of time and is prone to errors.
Power BI: Power BI can automate reports. Update them without anyone needing to do anything. This saves a lot of time. Reduces errors.
5. Career. Salaries
Excel: Knowing Excel is expected for office jobs but its not enough to stand out. Jobs that only use Excel usually don’t pay well.
Power BI: Power BI skills are in demand and professionals who know Power BI can get high paying jobs like Business Intelligence Analyst or Data Analyst.
Direct Comparison Table
Feature | Microsoft Excel | Microsoft Power BI |
Main Focus | Calculations, data entry and financial modeling | Data modeling, automation and business intelligence |
Big Data | Limited to one million rows | Can handle billions of rows |
Interactivity | Basic not interactive | Fully interactive |
Reporting | Usually manual | Automated |
Formulas | Spreadsheet functions | Data Analysis Expressions DAX |
Career Roles | Operations, finance, admin | Business Intelligence data analysis |
Real World Scenarios: When to Use Which Tool
In the corporate world you won’t always use just one tool. Knowing which tool to use for a problem is what makes a senior professional.

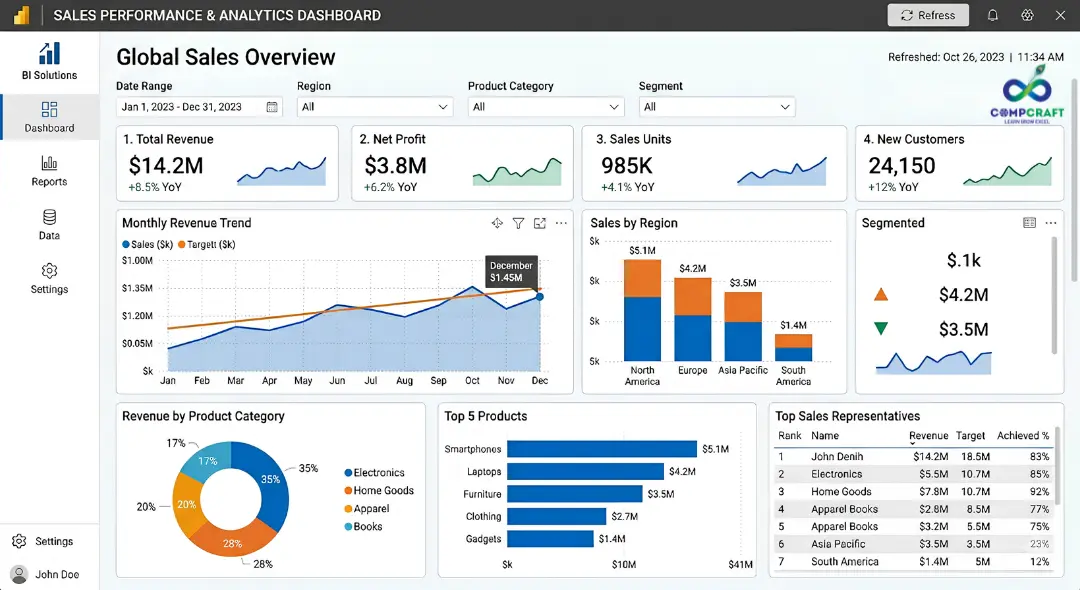
Scenario A: Building a Sales Dashboard
Imagine a company with many stores. The leadership team wants a dashboard to track sales, top products and inventory levels in real time.
The Right Tool: Power BI. You would connect Power BI to the companies databases automate updates. Build an interactive dashboard.
Scenario B: Pitching a Startup Valuation Model
You are working on a fundraising pitch for a startup. You need to forecast growth over five years based on changing assumptions.
The Right Tool: Excel. Excel is perfect for modeling and you can adjust variables live in a meeting to see how they impact profitability.
Which Tool is Better for Career Growth?
If you look at the job market Power BI is the winner for career growth.
Companies want live automated insights, not reports. By knowing Power BI you can architect automated data pipelines and design interactive dashboards making you a strategic business partner.
Here’s a secret: The best data analysts use both Excel and Power BI.
Because both tools are from Microsoft they work together. Learning Power BI is easier if you already know Excels Power Query interface. Many companies use Power BI to clean data then let advanced users connect to that data using Excel for analysis.
If you want a career in data analytics that really takes off you should spend your time on a business analytics course near you. This is the way to connect what you learn in class to what actually happens in the industry. You can get help from people who work in the field which can save you a lot of time and confusion.
For people who want to work in tech and business in Mumbai it is really important to have projects that you can show to recruiters. CompCraft has a data analytics training program that teaches you everything from the basics of Excel to complicated things like DAX modeling and Power BI reporting. If you are looking for a Power BI course in Charni Road this is an option. The school focuses on using business data and making interactive dashboards so you will have a good portfolio when you go to job interviews.
Final Verdict: Your Action Plan
Do not stop using Excel but make sure you know how to use tools too.
If you are just starting out you should start by learning the advanced features of Excel like PivotTables and data cleaning. Once you know how to do these things you should start learning Power BI away. You need to understand how data modeling works, how to get data from sources and how to write DAX measures that are easy to understand. If you know how to use Excel and Power BI you will be very attractive, to people who hire for jobs. This is because you will know how to use the easy features of Excel and the powerful features of Power BI.
Hey everyone! If you have ever walked into a shop in Mumbai, bought a laptop, or even ordered food online, you have …

If you are new to business or managing accounts in Mumbai, you have probably heard the term ledger quite often. It sounds …
Introduction Have you ever bought a smartphone from an electronics shop and received a printed paper showing the amount you paid along …

Introduction: The Hidden World Behind Your Screen If you pick up your phone right now, what is the first app you will …

Every morning most of us in Mumbai wake up and instinctively reach for our phones. We check WhatsApp scroll through train updates …

Every week at our center I get the exact same question from students. They walk in look at the course list and …

Have you ever wondered what happens behind the scenes of your apps like Instagram, Spotify, or Netflix? Every time you scroll through …
Imagine you are sitting in a boardroom or staring at a laptop screen looking at a spreadsheet with 10,000 rows of raw …

If you have spent any time on Instagram, LinkedIn or any other new platform that has come up, you have probably noticed …

Think about the last time you asked someone for directions and ended up completely lost. It wasn’t because they didn’t know the …

Have you ever wondered why your phone can instantly unlock by looking at your face while a traditional computer program still struggles …

Imagine you want to hire a chef for your fancy restaurant.. Instead of hiring someone who already knows how to cook you …
The interview is going well until the hiring manager slides a laptop across the mahogany desk. “Here is a raw export of …
Have you ever spent three hours building a report only for it to completely break because you inserted a single new column?. …
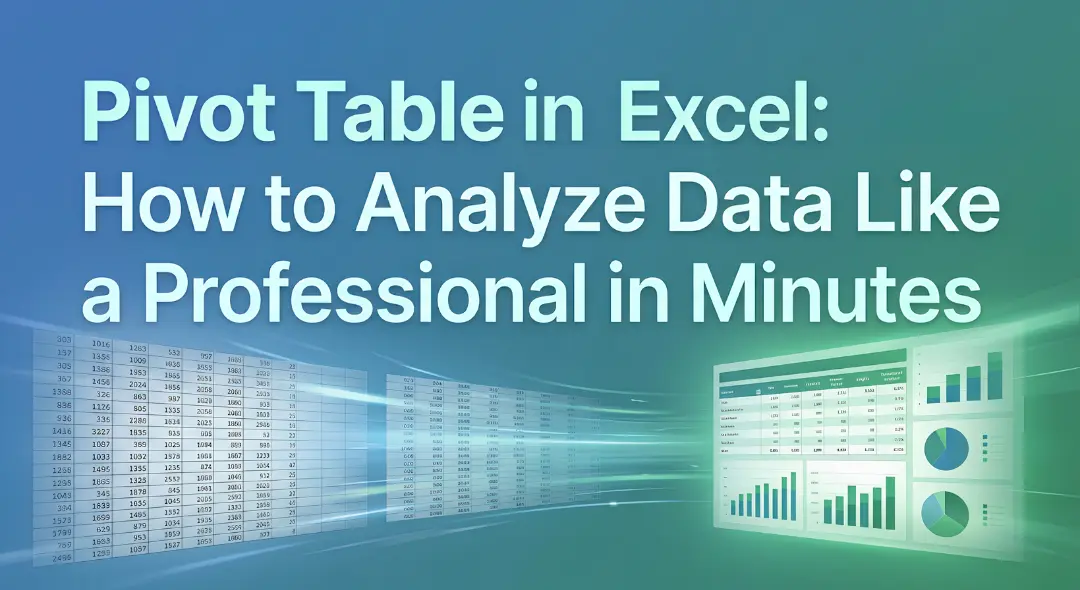
A Pivot Table in Excel is a tool to analyze data. It is 5:30 PM on a Friday. Your manager comes to …

Imagine you have just opened a high-end boutique in the bustling lanes of South Mumbai. You have the inventory, and the decor …

Have you ever been sitting at a cafe near Marine Lines chatting with a friend about needing a new laptop only to …

Data is everywhere. Numbers and columns do not tell a story on their own. If you have ever tried to share a …