Every business from a small store in South Mumbai to a large company runs on numbers. But have you ever wondered how …

The interview is going well until the hiring manager slides a laptop across the mahogany desk. “Here is a raw export of our last quarter’s logistics data,” they say calmly. “I need you to identify the top three most expensive shipping delays and tell me which vendor is responsible. You have ten minutes.”
This isn’t a test of your typing speed. It is a test of your mental architecture.

In the modern corporate landscape, data is the new oil, but Advanced Excel is the refinery. Without the ability to process, filter, and extract meaning from thousands of rows of raw information, you aren’t just slow, you are essentially invisible to high-level recruiters. While many claim “proficiency” on their resumes, very few can actually build a dynamic, self correcting system that solves business problems in real time.
Beyond the Search: Mastering the Logic of XLOOKUP
For years, VLOOKUP was the gold standard, but the shift explained in : Which Excel Function Should You Use in 2026 shows why modern professionals are upgrading. But if you want to show a recruiter you are ahead of the curve, you talk about XLOOKUP.
The Concept and Execution
XLOOKUP is a “three-in-one” powerhouse. It searches for a value in one array and returns a corresponding item from another. Unlike its predecessor, it doesn’t care if your data is to the left or right, and it has a built-in “if not found” feature, so your sheet doesn’t get cluttered with ugly #N/A errors.
Real-World Job Usage
Imagine you are a Finance Associate at a multinational firm. You have a massive sheet of “Product Codes” and a separate sheet of “Current Market Prices.”
The Task: You need to pull the price for 1,500 line items to calculate an invoice.
The Practicality: One XLOOKUP formula can cross-reference these two separate datasets instantly.
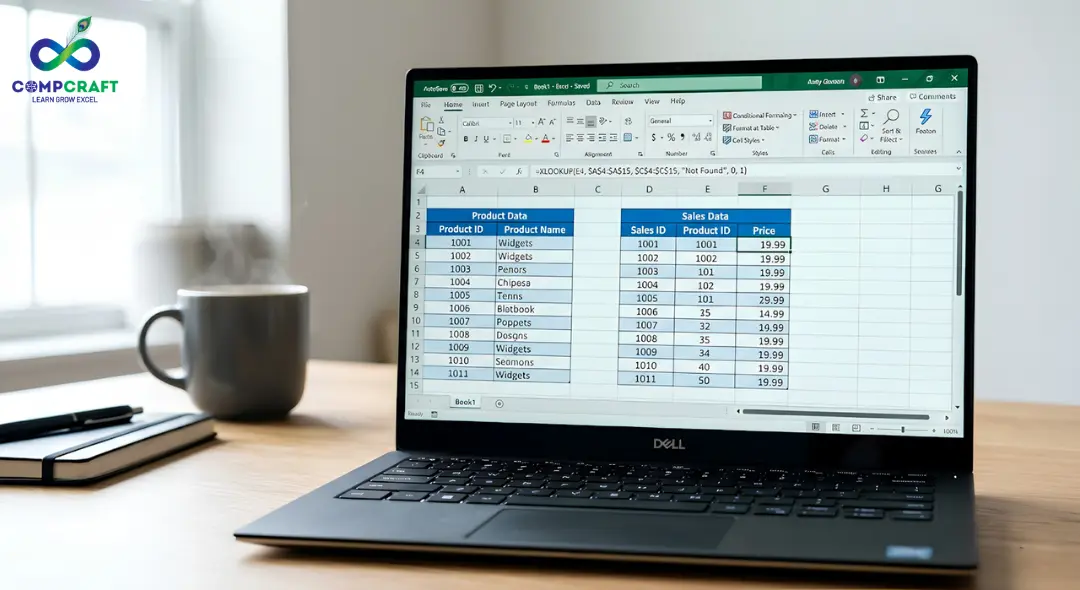
If a price changes in the master list, your invoice updates automatically.
The “Hired” Factor: Companies value this because it eliminates “data silos.” It proves you can connect different departments’ information without manual copy-pasting.
The Decision Makers: IF, AND, and OR
If you can’t tell Excel how to think, you’ll be doing the thinking for it, which is a waste of your salary.
How it Works
Logical functions allow the software to make choices. A “Nested IF” statement is like a digital flowchart: If sales > 1M, then “Elite”; if sales > 500k, then “Pro”; else “Standard”.
Real-World Job Usage: The MIS Report
Management Information Systems (MIS) depend entirely on these logical triggers.
The Scenario: You are managing a Sales Report.
The Formula: You use a Nested IF to automatically flag “Low Performing” stores in red and “High Performing” stores in green.
The Result: Instead of a manager squinting at numbers, they see a color-coded dashboard that tells them exactly where the fire is.
Failure to Know This: You’ll spend your Friday nights manually highlighting cells, while your peers who took an advanced Excel course are already heading home.
Summarization at Scale: SUMIFS and COUNTIFS
The “S” at the end of these formulas is the difference between a beginner and a professional. It allows for multiple criteria.
The Practical Breakdown
While a basic SUM adds a column, a SUMIFS adds values based on a complex set of rules. For example: “Total the revenue, but ONLY for the ‘Electronics’ category, ONLY in the ‘West’ region, and ONLY for ‘Q3’.”
Real-World Job Usage
In a data-heavy role, you might be asked to find the total overtime pay for a specific department during a holiday weekend.
Step 1: Define the sum range (Salary).
Step 2: Define Criteria 1 (Department = IT).
Step 3: Define Criteria 2 (Date = Weekend).
The Impact: This allows you to perform “surgical” data analysis. You aren’t just giving a total; you are giving a specific, actionable insight.
The Storyteller: Pivot Tables & Slicers
If formulas are the individual words, a Pivot Table is the entire story, and if you want to understand this skill in depth, you should explore Pivot Table in Excel: How to Analyze Data Like a Professional in Minutes. It is the single most important skill for anyone pursuing an Excel course for a job in Mumbai.
The Step by Step Value
Cleaning: You take a messy dump of raw data.
Pivoting: You drag “Years” to rows and “Profit” to values.
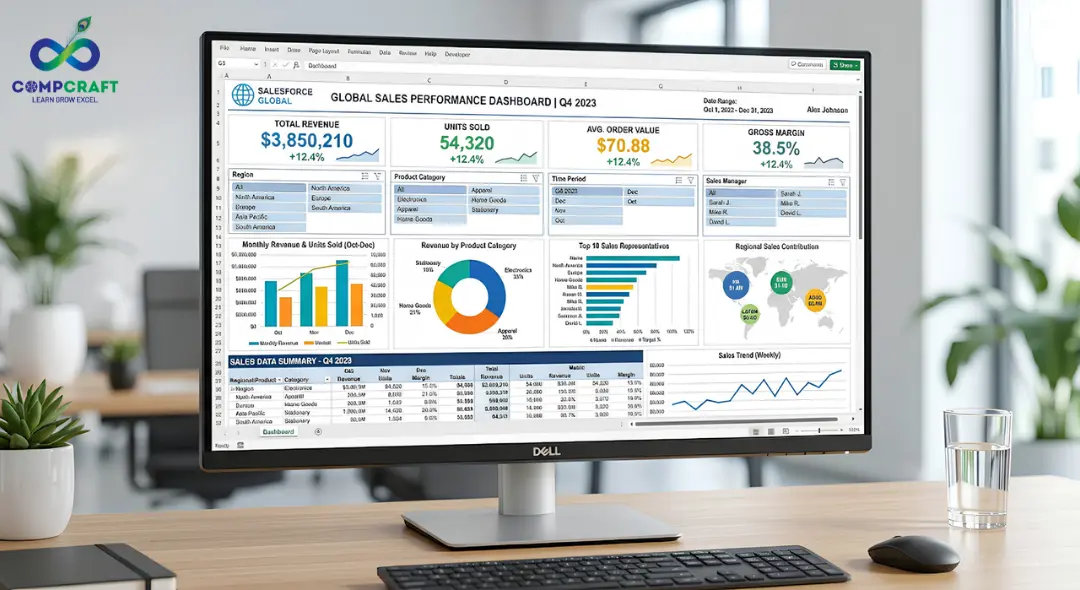
Visualizing: You add a “Slicer” (a visual button) that lets your boss click “Region” to see the data change instantly.
Job Application
In a marketing agency, you use this to track campaign performance. Within seconds, you can show which ad platform (Instagram vs. LinkedIn) is providing the best Cost Per Lead without writing a single line of code. If you don’t know Pivot Tables, you are essentially trying to build a skyscraper with a hand-screwdriver.
The “Hidden” Architecture: Power Query and Data Automation
While formulas handle the logic, the true “power user” status is reached when you stop performing the same tasks every morning. In a fast-paced environment, repetition is the enemy of growth. This is where Power Query becomes your secret weapon.
What it is and how it works
Power Query is an automation tool built into Excel. Imagine you receive a daily sales CSV file from five different branch managers. Normally, you’d spend 45 minutes copying, pasting, and cleaning that data to make it fit your master report. With Power Query, you simply “point” Excel to a folder. It sucks in the data, removes the blank rows, fixes the date formatting, and merges the files automatically.
The “Job Ready” Advantage
When you can tell an employer, “I can automate your weekly data consolidation so it happens in one click,” you aren’t just an applicant; you are a solution. Most companies don’t realize their manual processes are costing them hundreds of man-hours. Bringing this level of automation to the table makes you indispensable. It’s the difference between staying late to finish a report and having it ready before your morning coffee is cold.
Strategic Data Visualization: Beyond Basic Charts
Being “job-ready” means knowing that your data must be persuasive. Executives don’t have time to dig through cells; they need insights, which is exactly what is covered in Data Visualization Techniques: How to Turn Complex Data into Simple Insights.
This involves combining Pivot Tables with “Slicers” and “Timelines” to create an interactive experience.
If you can build a dashboard where a manager can click a button to see “Profitability by Sales Rep” for “May 2026,” you have mastered the art of professional communication. This high-level synthesis is exactly what companies are looking for when they hire Business Analysts. It shows you don’t just “do” the work—you “present” the value.
Avoid These Professional “Red Flags”
Companies often look at how you structure your Excel files as a window into how your brain works. Common mistakes that get people passed over for promotions include:
Hard-Coding Values: Never type “18% GST” into a formula. Put it in a separate cell and reference it. Professionalism is about making sheets that are easy to update.
Lack of Error Handling: A sheet full of #REF! The errors look amateur. Learning the IFERROR function is a mandatory part of any advanced Excel training.
Messy Formatting: If your columns aren’t aligned and your headers aren’t frozen, your work is hard to read. A pro knows that “Presentation is Part of the Product.”
The High Demand Skillset
Why is there such a push for advanced Excel classes near Charni Road Station or other business hubs? Because the “Skills Gap” is real. Employers are tired of training new hires on the basics. They want someone who can hit the ground running on day one.
When you master these tools, you stop being a “Data Entry Clerk” and start being a “Business Analyst.” The difference in those two job titles is often a doubling of your annual salary. Mastering the advanced Excel course curriculum turns you into a strategist who can predict trends rather than just record them.
Your Next Step
The transition from basic spreadsheets to advanced automation doesn’t happen by accident. It requires a structured approach to learning how these formulas interact in real business cases.
If you want to master these Excel skills with real datasets and job-focused training, programs like this Advanced Excel Course can help you become job-ready faster. Our curriculum is built around the exact reports you will be expected to create in a professional office environment. Whether you are looking for an advanced Excel Course in Charni Road, Mumbai, or simply want to sharpen your skills for a promotion, the best time to start was yesterday; the second best time is now.
Final Thought
The corporate world speaks in data. Are you ready to join the conversation?
What specific Excel hurdle is currently slowing down your workflow?
Hey everyone! If you have ever walked into a shop in Mumbai, bought a laptop, or even ordered food online, you have …

If you are new to business or managing accounts in Mumbai, you have probably heard the term ledger quite often. It sounds …
Introduction Have you ever bought a smartphone from an electronics shop and received a printed paper showing the amount you paid along …