Every business from a small store in South Mumbai to a large company runs on numbers. But have you ever wondered how …

Data is everywhere. Numbers and columns do not tell a story on their own. If you have ever tried to share a spreadsheet with someone you know how confusing it can be. That is where Power BI comes in it helps turn data into clear and useful information.
Power BI is a tool that allows anyone to connect to different data sources clean up messy information and build interactive dashboards that update automatically. Whether you are a student, a professional or someone who uses Excel a lot learning Power BI can open up career opportunities.
Let us break down the steps you need to go from a page to an advanced interactive dashboard.
Why Power BI Dashboards Matter
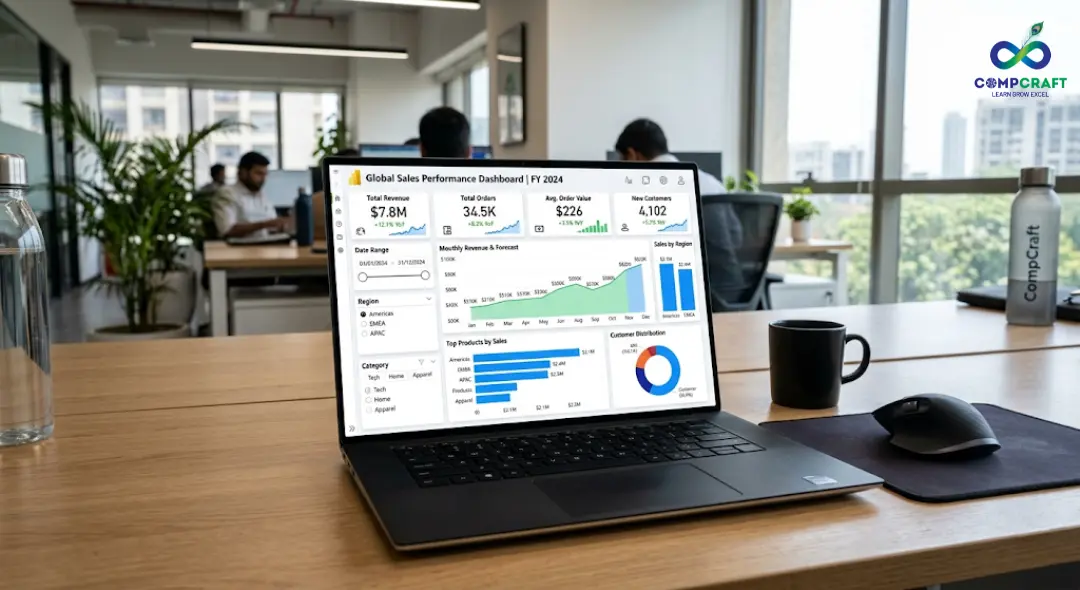
Before you start, it helps to understand what a dashboard is. In Power BI, a dashboard is a single page summary that highlights the important elements of your data. It is like the dashboard of your car; it shows you the important information at a glance.
For businesses, these summaries are very useful. By looking through many tabs, a manager can open one page to see the most important information, such as top selling products, profit margins, and inventory alerts. The best part is that you can click on an area and it will show you the data for that area only.
The Step by Step Power BI Workflow
Building a dashboard requires a structured process. If you skip steps or rush into the visuals before organizing your data, you will end up with calculations and broken charts.
Step 1: Importing Your Data
The process begins by bringing your data into the system. Power BI can connect to sources, including Excel files, PDFs, SQL databases, and cloud services like Google Analytics.
To start, you use the Get Data feature on the home tab. For example, if you are building a sales report, you might import an Excel spreadsheet containing your transaction history and a web based table listing product categories.
Step 2: Cleaning Data in Power Query
Raw data is always messy. You might run into dates, inconsistent capitalization, or columns containing mixed information that should be split apart.
Power BI handles this through a built in tool called Power Query. Think of Power Query as a processing plant. Every action you take is recorded, and the time your source data updates Power Query automatically re runs these exact steps, saving you hours of repetitive data cleaning work.
Step 3: Data Modeling and Establishing Relationships
Once your data tables are clean, you need to teach them how to talk to each other. This is called data modeling.
Imagine you have two tables, one for Orders and one for Customers. To find out which customer spent the money, you must link both tables using a common field, such as the Customer ID.
Step 4: Crafting the Visualizations
With a data model in place, you can finally move to the canvas. Power BI offers a library of standard visuals ranging from classic bar charts to advanced maps and scatter plots.
The secret to visualization is matching the chart type to the question you want to answer. For example, Line Charts are ideal for showing trends over time, Bar Charts are perfect for comparing categories, and Cards are best for displaying single high impact numbers.
Step 5: Assembling the Dashboard Layout
A collection of charts is not automatically a dashboard. You need to arrange them using a layout. Place your critical high level metrics at the very top left group, related charts close together, use plenty of whitespace, and stick to a clean professional color palette.
Elevating Your Reports with Advanced Concepts

Once you are comfortable with the layout, you can start using advanced features to transform a standard static report into an intelligent interactive tool.
Mastering DAX Basics
Data Analysis Expressions (DAX is the formula language powering calculations within the platform. If you have ever written formulas in Excel, DAX will feel somewhat familiar. It operates with a focus on entire tables and filtered contexts rather than individual spreadsheet cells.
Instead of creating hundreds of manual calculations, you use DAX to build dynamic metrics. For instance, a basic DAX measure to calculate revenue looks like this: Total Revenue = SUM(Sales[Amount])
Filters, Slicers, and Interactivity
The power of a modern business report is that the audience can customize their view on the fly. You can achieve this by adding Slicers, which are on-screen interactive filtering buttons.
Storytelling with Data
Advanced dashboard design focuses heavily on user experience. You can use features like Tooltips and Drill Throughs to turn a corporate report into an engaging visual narrative.
Common Beginner Mistakes to Avoid
Learning an analytics platform comes with a few predictable hurdles. Watch out for these missteps when building your first few projects:
The Overcrowded Canvas: Trying to cram many charts onto a single page makes the layout impossible to read.
Ignoring the Data Types. If a column containing numbers is accidentally labeled as text during the import phase, you will not be able to sum or average those values later.
Relying on Dark Mode Much. While high contrast dark dashboard themes can look sleek, they often become exhausting to read during long business meetings.
Practical Tips for Better Performance
To ensure your reports load quickly and remain easy to navigate, keep these practices in mind:
Keep it Simple. Only import the specific columns and rows your report actually needs.
Label Everything Clearly. Avoid confusing database shorthand.
Design for Your Audience. Always build with the end user in mind.
Launching Your Data Analytics Career
As companies rely heavily on data to make decisions, professionals who know how to interpret and visualize that information are in high demand. Developing these skills is one of the reliable ways to fast track your data analytics career growth.
For professionals and students looking for hands on guidance, structured learning can make all the difference. Enrolling in comprehensive Power BI classes in South Mumbai provides access to industry mentors, structured case studies, and real world project portfolios.
With an understanding of the core workflow, you are fully prepared to transform messy business data into clear, impactful visual stories. Turn on the application, load up a practice dataset, and start building your first interactive dashboard today.

Hey everyone! If you have ever walked into a shop in Mumbai, bought a laptop, or even ordered food online, you have …

If you are new to business or managing accounts in Mumbai, you have probably heard the term ledger quite often. It sounds …
Introduction Have you ever bought a smartphone from an electronics shop and received a printed paper showing the amount you paid along …

Introduction: The Hidden World Behind Your Screen If you pick up your phone right now, what is the first app you will …

Every morning most of us in Mumbai wake up and instinctively reach for our phones. We check WhatsApp scroll through train updates …

Every week at our center I get the exact same question from students. They walk in look at the course list and …

Have you ever wondered what happens behind the scenes of your apps like Instagram, Spotify, or Netflix? Every time you scroll through …

If you want to get into the data analytics field or if you want to improve your skills you probably have a …
Imagine you are sitting in a boardroom or staring at a laptop screen looking at a spreadsheet with 10,000 rows of raw …

If you have spent any time on Instagram, LinkedIn or any other new platform that has come up, you have probably noticed …

Think about the last time you asked someone for directions and ended up completely lost. It wasn’t because they didn’t know the …

Have you ever wondered why your phone can instantly unlock by looking at your face while a traditional computer program still struggles …

Imagine you want to hire a chef for your fancy restaurant.. Instead of hiring someone who already knows how to cook you …

The interview is going well until the hiring manager slides a laptop across the mahogany desk. “Here is a raw export of …
Have you ever spent three hours building a report only for it to completely break because you inserted a single new column?. …

A Pivot Table in Excel is a tool to analyze data. It is 5:30 PM on a Friday. Your manager comes to …

Imagine you have just opened a high-end boutique in the bustling lanes of South Mumbai. You have the inventory, and the decor …

Have you ever been sitting at a cafe near Marine Lines chatting with a friend about needing a new laptop only to …